How A SaaS Revenue Waterfall Helps Your Business
You may have come across 'Revenue waterfall' a few times in your sales and finance departments. But what the heck does it mean? When you first hear the term, you'd think it sounded like something straight out of a financial horror movie. You know, all the numbers are dripping red, and everyone's screaming because they're losing money. But it's not as bad as it sounds. In fact, you might even have a reason to love waterfalls. Read this to find out.

What is SaaS revenue waterfall?
Turns out, a revenue waterfall is just a visual way of representing how money flows through your business. It refers to how you distribute revenue across one or more periods. Kind of like a flowchart but with dollar signs instead of arrows. It's a way of seeing how booked revenue is recognized as GAAP revenue. GAAP stands for Generally Accepted Accounting Principles. GAAP requires revenue to meet specific conditions before you can include it in financial statements.
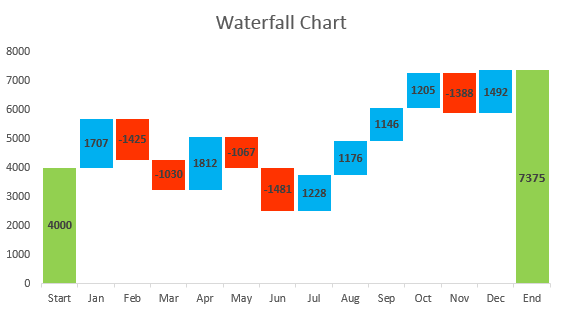
A simple SaaS waterfall chart displays how to arrive at your net ARR (or MRR if measuring quarterly). In a simple chart, you'll have three main elements: your starting ARR, the floating columns (representing new contracts, expansions, churn, upgrades, and downgrades), and your ending ARR. In the chart, Starting ARR and Ending ARR are constants, while the columns constantly move up or down to reflect your business's positive and negative changes.
Why Should You Create A Recurring Revenue Waterfall Report?
It’s critical to plan and track the cash flow in your business. Revenue waterfall reports help you track recognized and upcoming subscription revenue amounts from your existing contracts. Combining this 'tool' with sound business practices can improve your company's cash flow planning while reducing the chances of your sales reps and planners incorrectly forecasting future months' revenues.
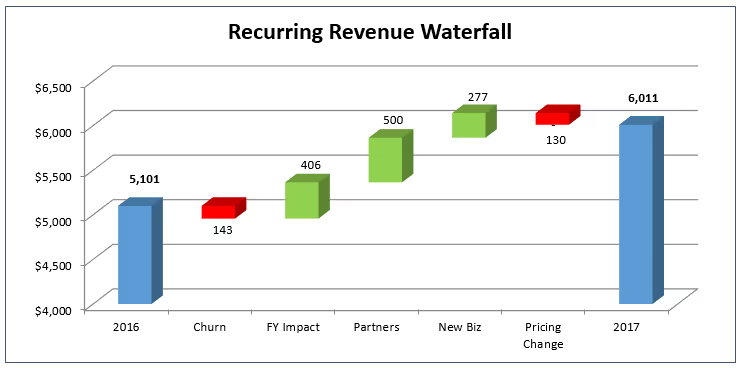
A recurring revenue waterfall shows the movement in your company's bookings and revenues. You gain insight into your progress. "What is our MRR like in July after having six upgrades and four customers churned?"
For public companies, a waterfall financial model has added advantages. It’s useful for founders and investors because it breaks down the company's value among the various shareholders, as their share of the value may differ from what's written on a cap table.
Who Uses This Type of Report?
Sales executives and CFOs usually use this report to track current and future recurring revenues.
How to make your own SaaS Revenue waterfall chart in Excel
You may want a quick visual of your revenue distribution for an investors' meeting or to discuss internally as a team. You can make a simple revenue waterfall chart in Excel. Here's Microsoft itself, showing a step-by-step process of creating one.
For the visual learner, you'll love watching this video. We recommend using Excel 2010 or later:
Build a Waterfall Chart in Excel in less than 5 Minutes
What is an ARR Revenue Waterfall Chart?
It's the same chart, only this time, it's reported in annual terms.
Other Tools for drawing a Revenue waterfall chart
You can save yourself the stress of manually generating your chart in Excel. Use any of these tools to auto-generate your chart:
Conclusion
A revenue waterfall chart isn't meant to scare you. A good one helps you to see how booked revenue turns into GAAP-compliant revenue. You also get a closer look into your company's financial health and know how to adjust to perform better.