How to Increase Feature Adoption in SaaS – The Complete Guide

TL;DR
- Feature adoption metrics help you know which product features are most valuable to users.
- The benchmark for a good feature adoption rate is 28%.
- Use different channels to boost feature discovery, including in-app changelogs and social media.
- Use the Buy-A-Feature framework to prioritize and build the features your users look forward to the most.
What makes products like Slack and Canva popular? Features. Not because of the number; you can have a bazillion features, but your product will only sell if its features meet the needs of users and blend well with the user experience.
Every product manager obsesses over getting users to adopt their features because it influences the stickiness of the product. But if your features are great, why won’t they stick?
After reading this guide, you’ll know:
- How to diagnose your feature adoption problem
- Tips and tricks to get customers using and loving your features.
What is SaaS feature adoption?
Feature adoption refers to your users actually using a feature of your product. Users are said to have adopted a feature when they’re aware of it and use it regularly. But it’s important to note that feature adoption only really works if you add features that offer a solution to your users’ problems. Without feature fit, adoption won’t happen.
Why is feature adoption important?
First, feature adoption means that you are helping your users achieve their JTBD (jobs-to-be-done). Your product is adding value – that’s music to a founder’s ears!🥂
Secondly, feature adoption helps to decrease customer churn. That’s because customers who keep getting value from your product features are unlikely to cancel their subscription. Instead, as customers gain value, they stick around, engage more with your product, and become loyal brand advocates.
On the other hand, if people are not using your feature, that tells you something important about either the feature itself or how you’ve introduced it. Usually, it means people are unaware of the feature or perceive that it won’t be valuable to them.
How is feature adoption different from product adoption?
Product adoption plays a critical role in product-led growth. Users start to adopt your product when they begin a trial or start using a free version of your product. They have fully adopted your product when they become regular users and convert to paying customers.
Feature adoption is an important contributor to product adoption. Basically, since your product is the sum of its features, it means the more features your users adopt, the deeper the product adoption.
Feature adoption breaks down exactly which use cases or features bring the most value to users. With this data, your product team can know which features are most valuable in increasing conversions and which ones to drop. This helps make your product more relevant to your customers and improves retention.
It’s also useful information for your sales and product marketing teams who can use this information to promote the features your users care about most.
Feature AdoptionProduct AdoptionMeasures users’ interaction with a specific featureFocuses on users’ overall usage of productTells you what parts of your product are most successfulTells you if users are adopting your core feature set and offering
How to know a feature is adopted
The SaaS feature adoption funnel is a popular way for PMs to think about user behavior in the different stages of feature adoption. This is how it works.
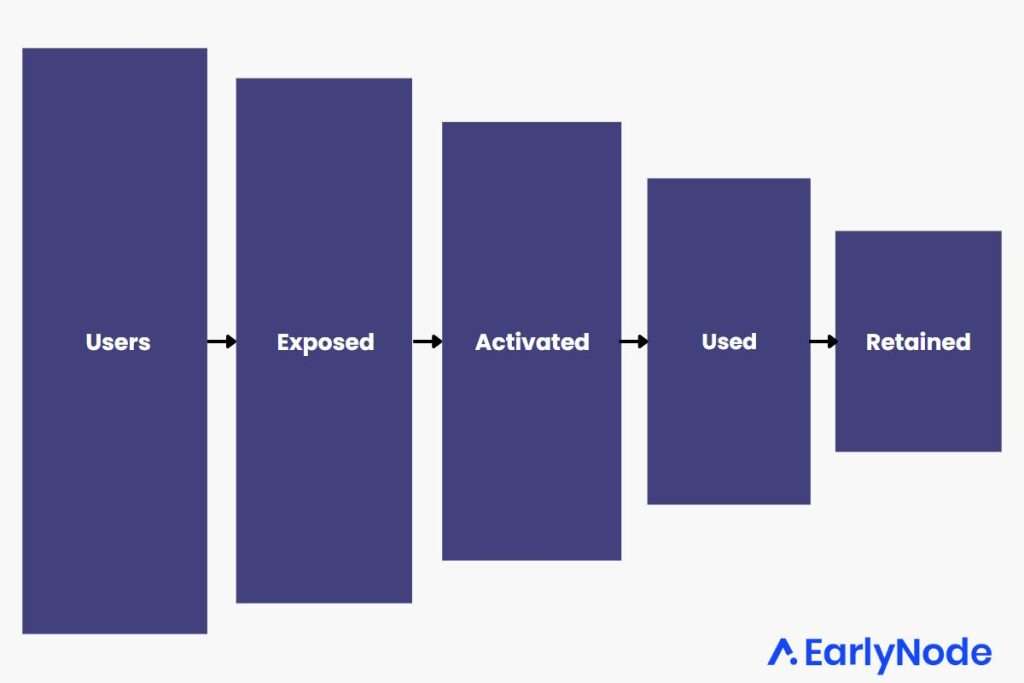
Step #1 Exposure
This stage measures how many users became aware that the feature exists. It’s also known as the feature discovery rate. You need to know this before calculating your feature adoption rate because your results will be fuzzy if you don’t know how many users know a feature exists.
This is the formula for your exposure rate.
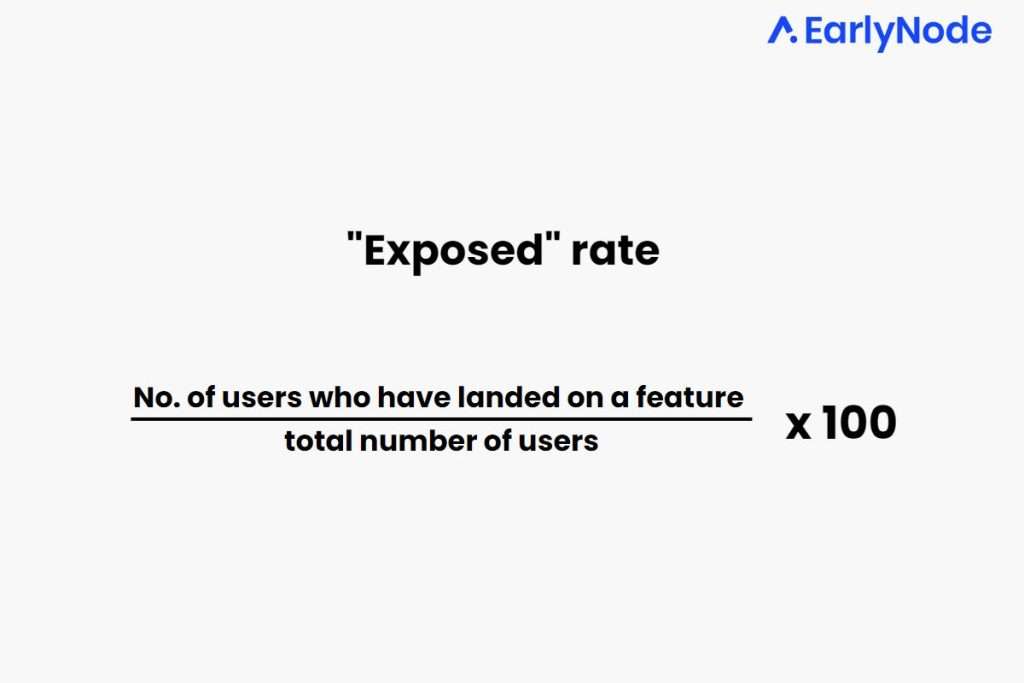
For example, if you have 1000 new users and only 300 of them landed on the feature, your exposure rate is 30%. Ideally, you would want a 100% rate, but that’s impossible. If you think your exposed rate is low, figure out how to make the feature easily discoverable. For example, add new features to your onboarding experience or communicate them via social media, or your changelog.
Step #2 Activation
Next we consider how many of these exposed users tested the feature. Let’s use Slack’s huddle feature as an example. You may have been exposed to it through a tooltip or maybe a team member pointed it out to you. Activation, in this case, will be to start your own huddle.
So if Slack calculated their activation rate for this feature, they’d be looking at % of users who know about it and have started a huddle. At this point, duration doesn’t matter. What matters is if a user made a move to try the feature after exposure.
Let me point out that some features may not have a unique activation stage to track. So this stage may sometimes overlap with the used stage.
Step #3 Used
This is the percentage of activated users who successfully used the feature at least once. For some features, the used stage is the same as the activation stage due to the nature of the feature.
A smart way to track this stage is to define an action that lets you know that a feature has been successfully used. In other words, if a user tests the feature and performs what we call a success action then that action counts as used. This way, if people keep failing to complete that success action, you would know that it's likely due to UX or potential bugs.
Let’s use the huddle feature example again. The success action is for another person to join the huddle and for both parties to successfully engage in a voice call for at least 30 seconds. If nobody else joins the huddle, or there’s no successful call, the user has activated the feature but has not used it yet.
Step #4 Retained
This stage tracks whether the feature was used repeatedly by those who used it at least once. If most users utilize a feature repeatedly over time, that’s the clearest sign it’s been adopted.
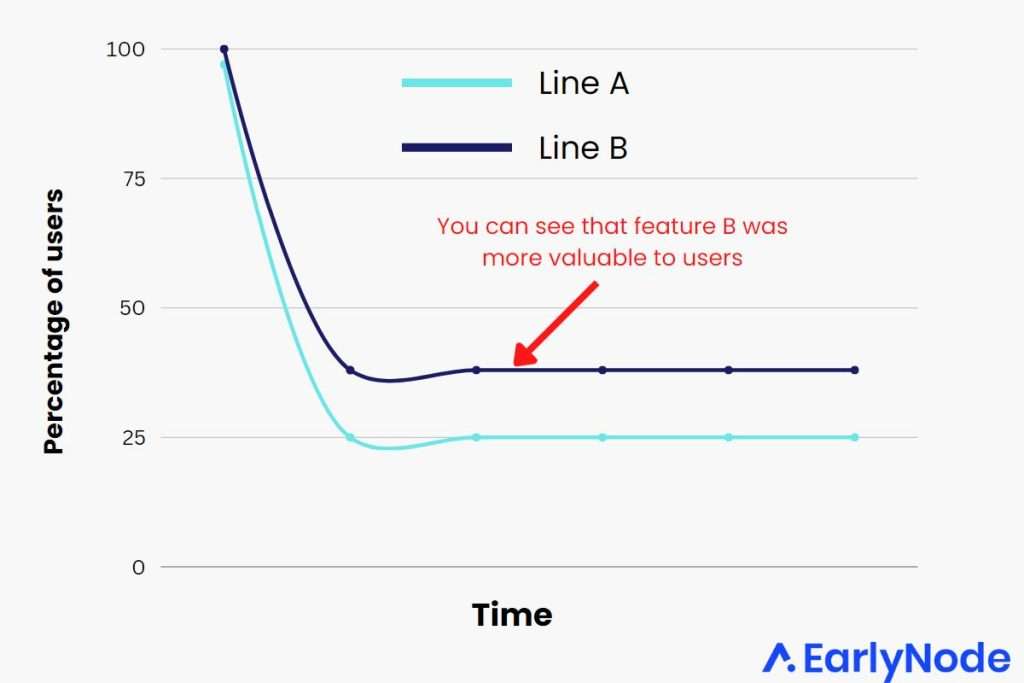
The goal is to get the feature’s retention curve to flatten out. A flattening curve shows that a consistent number of users found value in the feature and have continued using it over a long time.
The higher the level at which the curve flattens, the higher the percentage of users who are gaining value from the feature in the long term. It also means the feature is more valuable.
In the chart below, lines A & B represent retention scenarios for 2 different features. Both lines eventually flattened, indicating that both features are valuable. However, Line B flattens at a higher level. This shows that feature B was valuable to more users.
Feature adoption metrics to track
The main success metric of feature adoption is whether a feature’s main function is being used. For example, the main function of an online travel booking software could be the ability to book hotels. But in some cases, a feature may have a secondary function that solves an intermediate problem. In the travel booking example, the secondary function could be the ability to compare hotels.
While increased usage of this secondary feature is great, in the end, you want users to go a step further and use the feature for its primary function. In other words, the ability to compare hotels should ultimately lead to more bookings being made.
Tracking other metrics will give you a more comprehensive insight into how your features are being adopted and whether they are being used the way you want them to.
Why is it essential to track feature adoption?
You want to be sure each feature is providing real value to users because all your features collectively determine your product’s relevance. Tracking helps you gain various insights about your features to inform the future direction of your product. In particular, tracking helps you:
- identify the most used features that drive user retention.
- determine where in the adoption process users drop a feature.
- identify friction points in the UX that prevent feature adoption.
How to measure feature adoption
You can use analytics tools like Amplitude and Mixpanel to track user behavior while they’re using your app. For example, you can monitor how long a user stays on a feature in a session, which features they use the most, or whether they drop off after landing on a feature.
Let’s look at 6 metrics to track.
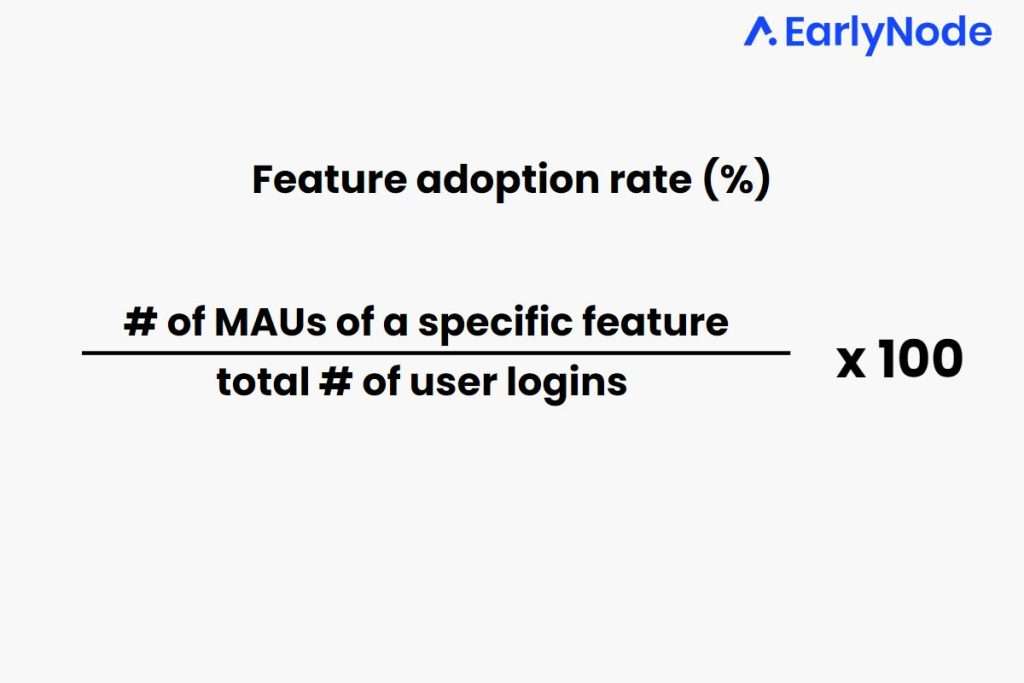
Feature adoption rate
The feature adoption rate is calculated by dividing the number of monthly active users of a specific feature by the total number of user logins in a specific period and multiplying the ratio by 100.
A high adoption rate means users find a feature useful and easy to use. A low adoption rate usually points to issues relating to the feature’s complexity or users’ awareness of the feature. Users will abandon a feature they find too difficult to use or not valuable enough.
Combining feature adoption rate with other key metrics will help you develop a well-informed product adoption strategy to make your product stickier.
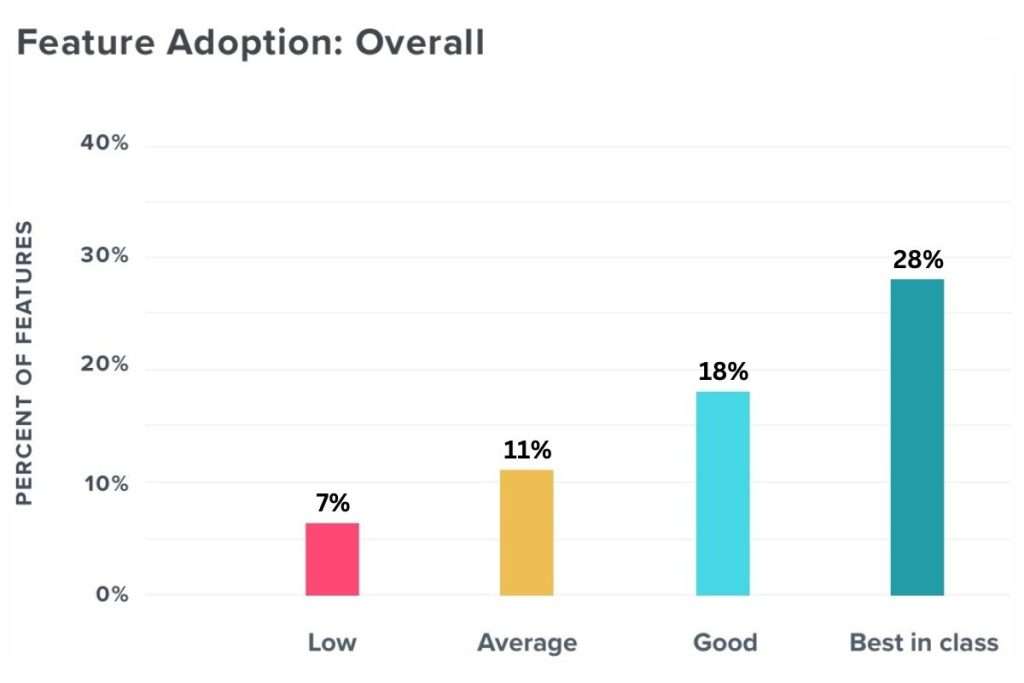
Feature adoption benchmarks
According to Pendo’s interactive product benchmark report, the benchmark for a good feature adoption rate in B2B SaaS is 28%. In other words, only 28% of a product’s features are regularly used. Your aim is to meet or better this figure.
Feature adoption by user segment
You can segment users in many ways. It may be useful to create user categories according to:
- Persona
- In-product actions taken
- Type of user (admin, collaborators, etc…)
- Plan (free, pro, enterprise)
- Department (HR, marketing, sales, etc…)
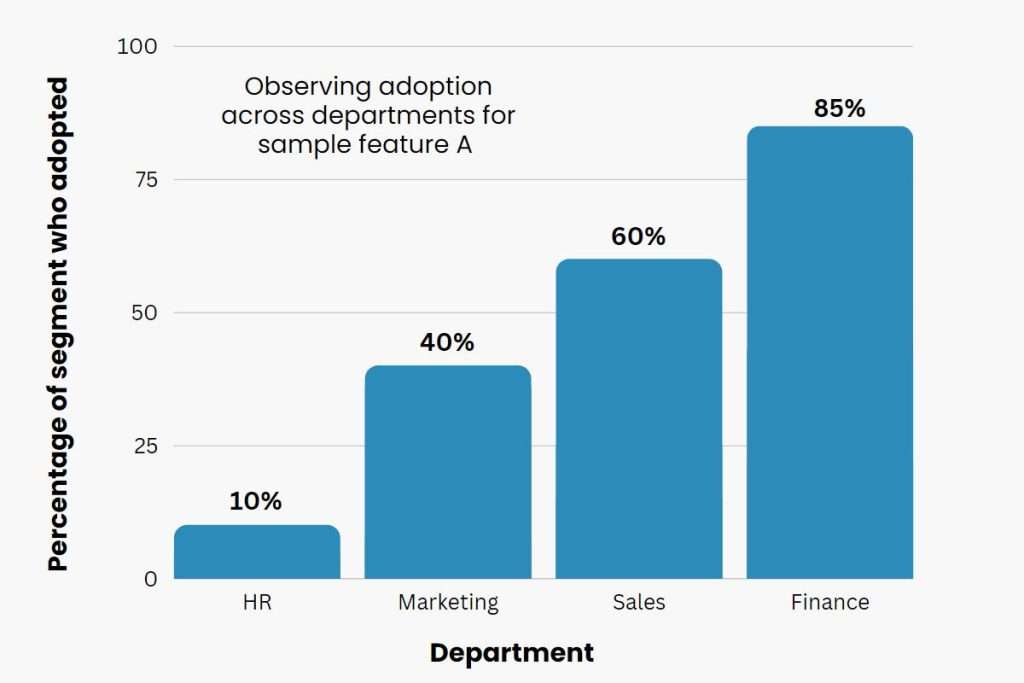
Feature adoption by user segment measures which groups of users have adopted the feature. It hints at which target users use the feature the most. This metric is especially important for horizontal tools like Airtable and Notion that can be used across different industries and departments.
For example, how many users in HR, marketing, sales, and finance adopted a specific feature? This will inform your product management efforts by suggesting which customers require the most attention.
Breadth of feature adoption
Refers to how much a feature has been adopted across your entire user base or a specific segment.

A high feature adoption breadth indicates that a wide range of your users finds the feature useful. For example, In the graph above we can see Feature 3 was the feature adopted by most users, meaning it’s highly valuable.
There are no studies with official benchmarks for this metric, but we think you should aim to have this figure at a minimum of 28% due to the benchmark figure from Pendo’s report above.
Depth of feature adoption
This metric shows how frequently users use the feature. It also hints at the feature’s ease of use.
A low depth means that the feature is being used less frequently than you expect. And that could probably be because they’re finding it difficult to use. Often, the solution is to adopt good UI/UX practices. It could also be that the feature isn’t valuable enough.
In that case, your product team should carefully consider if this feature is something users really want.
Time taken to adopt a feature
How long does it take before users adopt a feature after discovery? Are they using it immediately, or does it take some days or weeks? This metric gives an idea of whether there are UX issues, if the feature’s perceived value isn’t high enough, or if there is some other problem. For example, if it takes weeks or months, you probably have to look at improving your feature announcements.
Retention
Measures how long users sustained active use of a feature over time. Is it still in use after many months, and by how many users? For instance, 90% of your customers could use the feature when it is freshly launched, but then the majority of those customers could drop the feature after a month. That would be a very high adoption rate with poor retention.
A low retention figure tells you that the feature wasn’t valuable enough for users to stick to. Consider dropping it to focus on the sticky ones.
Now you know what you’re measuring. You need to know what to do to ensure the figures look good.
How to increase feature adoption – best practices
If your adoption rates are looking down, there are a few ways to beef them up.
Do multi-channel announcements

Using a multichannel approach to feature announcements helps you reach as many users as possible. You can share the big news via:
- Tooltips and popups
- In-app changelog
- Standalone changelog site
- Social media
- Blog posts
That being said, don’t throw everything everywhere every time. It’s possible to “over-announce” a new feature to the point that it becomes counterproductive. You’ll have more success if you tailor your announcement strategy to relevant user segments and the type of feature being launched.
For each announcement, it’s important to identify:
a) The right channel. Improvements and fixes are normally communicated via changelogs. Smaller features can be done via email, changelogs, social media, and in-app messaging. For major feature releases, go big – we’re talking PR, feature on Product Hunt, email, social media, and everywhere else to reach enough eyeballs.
b) The right timing. Time of day and day of the week makes a big difference when it comes to the impact of social media posts and emails. You can also keep an eye on which situations and triggers would let you know the perfect moment to launch a feature.
c) The right user. Use user segments to tailor announcements for the right user. For example, some of your users might be active on Twitter but those might not be the users who will benefit most from the feature you’re introducing. Similarly, marketing managers might care about different use cases from salespeople.
But while feature announcements should be critical in any feature adoption strategy, you can make your life simpler and up your feature announcement game by using a changelog tool like Releaselog, which is ideal for SaaS startups. It can help you send out beautiful feature announcements and product updates to your users in minutes.
Adopt good UX practices
Some features are never adopted because of “feature blindness” – where users only see features that they’re already used to. Others are abandoned because they’re confusing or complex. The antidote is good UX practices. For example, organize buttons, CTAs, and links to make them obvious and easy for users to locate so you can guide them to their intended destination.
Collect user feedback

Your customers are your best source of feedback, so consider their concerns and requests when making key decisions around your features. Conduct mini NPS surveys to gauge their satisfaction with a feature, then use the feedback to improve (or drop) the feature.
If you have a list of features in the pipeline, your product team can use the Buy-A-Feature prioritization model to prioritize and launch features your users look forward to the most.
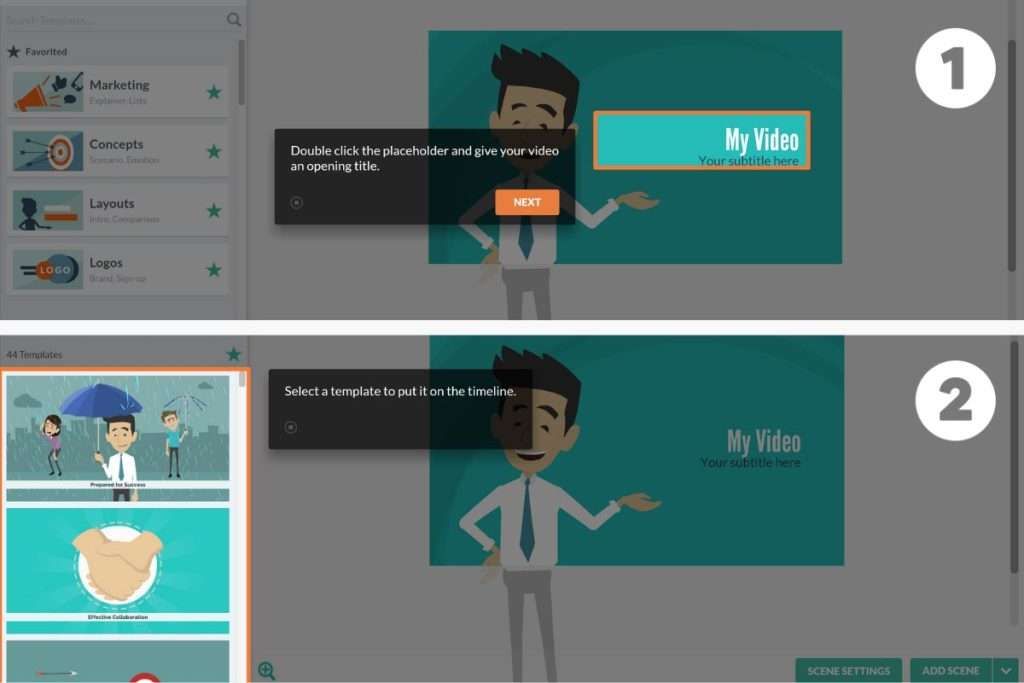
Use interactive walkthroughs
Interactive walkthroughs let users interact with your app as they’re guided step-by-step through how to use a feature. In other words, they learn by doing. You can create a walkthrough using tooltips or videos. Take a look at how GoAnimate uses tooltips to show users how easy it is to make a video:
Best tools for driving feature adoption
Some tools are better at driving feature adoption than others. Here’s a list of some to consider.
ChannelTool/AppStandalone changelog site & in-app changelog widgetReleaseLogWalkthroughs and tooltipsUserpilot, AppcuesEmailUserlistSocial MediaBuffer