Ultimate Guide to Product Usage in SaaS: Best Practices, Metrics, and Tools
TL;DR
- Analyzing product usage will help increase activation and conversion rates, and improve your customer experience.
- Some key product usage metrics include time-to-value (TTV), activation rate, logo churn, usage frequency, and session duration.
- Use in-app prompts to drive conversions in context.
- Study your power users and their in-app behavior to develop strategies for users with similar characteristics.
- Set and track in-app milestones as users journey through your SaaS app. E.g., completing a tutorial.
- Use session recordings to track in-app activity and heat maps to find high and low areas of engagement inside your app.
If every customer that came into your store got stuck in the revolving door you'd want to know about it. Or what if they filled a trolley but gave up at a long checkout queue? SaaS users are no different. It’s vital to know how your customers use your product, what features they love, and what gets in their way.
If users find a process difficult or keep missing key actions, your product won't seem very valuable to them and they’ll look for another option. On the other hand, if they regularly log in, spend the right length of time, and keep engaging with your features, it will boost your retention. Either way, you should know what they’re up to.
This guide will walk you through the benefits of product usage data and the metrics you need to track.
What is product usage data?
Product usage data refers to information about how users interact with your product. This includes the way they navigate through the app or website, the features they engage with, how long they stay in a session and how often they log in.
What type of product usage data should you track?
Data collected includes:
- Personal data: The user’s age, gender, company, role, industry, location, web cookies etc.
- Behavioral data: The user’s in-app behavior e.g., how they interact with features and their typical user journey inside the app.
- Engagement data: How the user generally engages with your software, e.g., sending a message, sharing to social media etc.
Why is it important to analyze product usage?
Running a SaaS business without tracking product usage is like flying blind. Usage analytics give you access to concrete data to help you make strategic decisions about your product.
This type of quantitative data can help you make more sense of the qualitative insights you get from user research. Usage data can also help your team and stakeholders decide what to prioritize when it comes to product decisions e.g., whether to focus on exposure or impact.
Let’s break down some important benefits of analyzing product usage.
⤵️ Increase activation rate
Usage data will highlight any issues trial users experience with your product. For instance, if users drop off too early during onboarding, it could be due to UX issues or features not fulfilling their jobs-to-be-done (JBTD) effectively. That data could help you streamline your features or process to activate users faster.
😄 Provide a better customer experience
User behavior data can help you create a better, more engaging product. A look at the hard data can reveal bugs, friction points, or some other issue in your product’s flow. Fixing these will make your in-product experience smoother and more satisfying for users.
You can also track which aspects of your product are most engaging to different user segments so you can design a more personalized user experience.
Additionally, your sales and marketing teams can rely on this data to target prospects similar to your super sticky and happy users.
📈 Increase conversions
Product usage data can be a tool to help you identify moments when trial users discover the value of your product. You can use these moments to create strategies to drive more conversions.
💡 Pro tip: Always look at your key metrics holistically. With every change, you risk boosting numbers for one metric while unintentionally making another metric suffer e.g., your conversion rate increases by 60%, but signups reduce by 50%. Consider how all metrics will be affected to make sure you’re moving in the right direction.
🧪 Tried and tested strategy: Most freemium users never become paying customers, but usage analytics can help change that. For instance, you can track which premium features your paying users find most valuable and then offer your free users a limited-time opportunity to try them out. If they experience the value of these paid features, they’ll be more likely to convert.
This is the "reverse trial method" used by PLG companies like Loom, Canva, and Airtable. Canva uses this strategy extensively with its background remover and image resizing features.
Key metrics to determine SaaS product usage
Time-to-value (TTV)
This is the amount of time it takes a user to get the value from your product (i.e., to reach the “aha” moment). This is important because customers expect to realize the value reasonably quickly. If your product doesn’t meet their expectations, they might simply drop it or find an alternative.
You can calculate time-to-value for new users during onboarding and for existing users if you launch a new feature. TTV is calculated by tracking the time from when users sign up (or discover a feature) to when they successfully complete an activation milestone.
Product activation rate
Activation rate measures the percentage of users who have successfully completed a key action or reached a certain milestone. Activation rates are usually tracked for new users. But like TTV, you can calculate the activation rate for a specific feature or group of features to get more granular insight.
The formula for activation rate is:
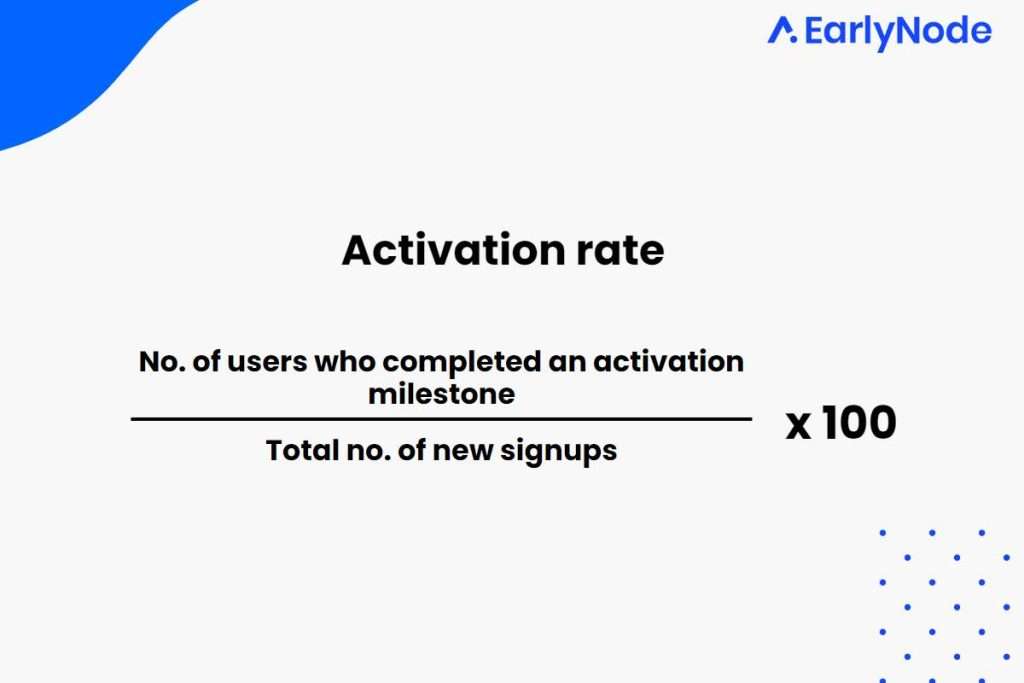
For SaaS products, the average activation rate is around 17% based on Mixpanel’s Product Benchmarks Report. But a good SaaS activation rate is around 30%, according to this survey.
Logo churn rate
This is the percentage of users who have stopped using your product. You want to keep this figure as low as possible. Take proactive measures to keep users engaged before they churn. One way to do that is to watch out for reduced usage.
Decide what levels of inactivity or low engagement mark the danger zone for churn. The moment a user gets to this level, try to re-engage them. Offer guidance to realize your product’s value, give discounts or announce your product’s latest features and capabilities. Also, provide excellent customer success to keep customers happy with your brand.
Logo churn is calculated by dividing the number of users lost in a specific period by the number of users you had at the start of that same period. Exclude any new users gained within this time period from your calculation.
Usage frequency
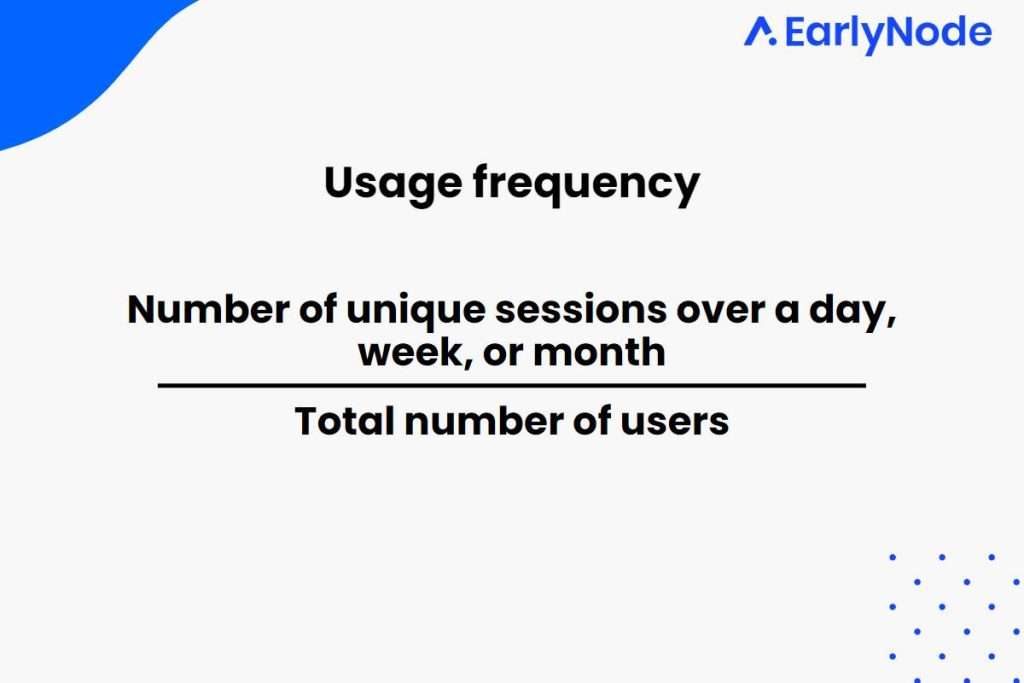
This metric represents how often a customer uses your product. Is it every day, a few times a week, or a few times per month?
To calculate usage frequency, choose a time period and count how many times a user logs in and uses your product. To get an average, you can use this simple formula:
Feature usage rate
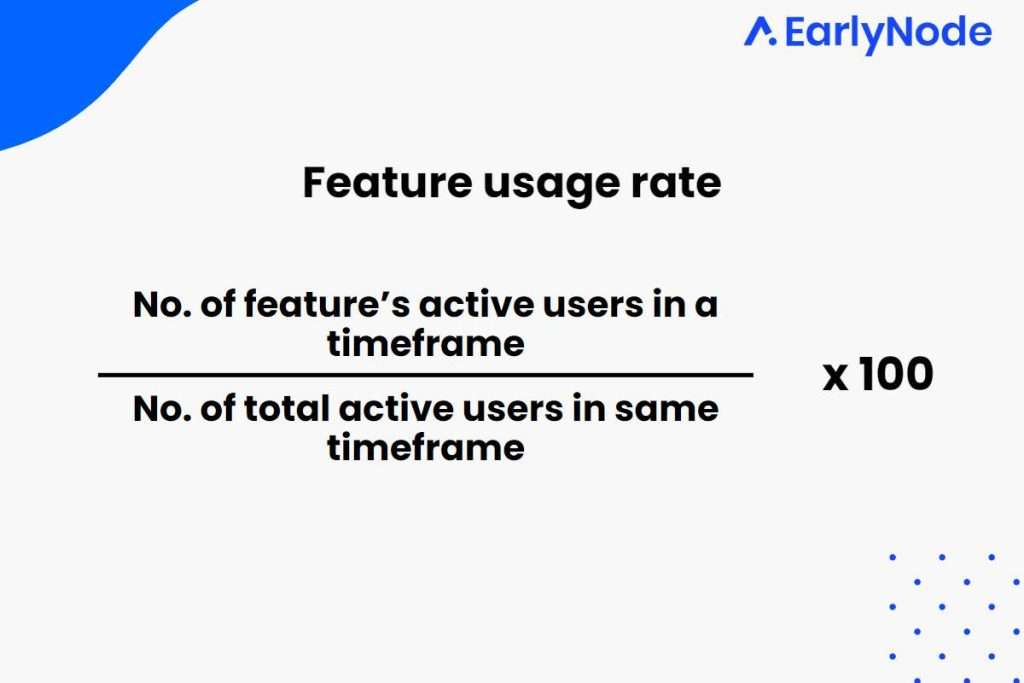
This metric gives you an idea of how customers use your product by measuring engagement with each feature. Tracking how many people use a specific feature helps you determine which ones drive value for your customers and which need to be improved (or dropped).
To determine a feature’s usage rate, count the number of active users, divide it by the total number of active users within that timeframe, and multiply by 100.
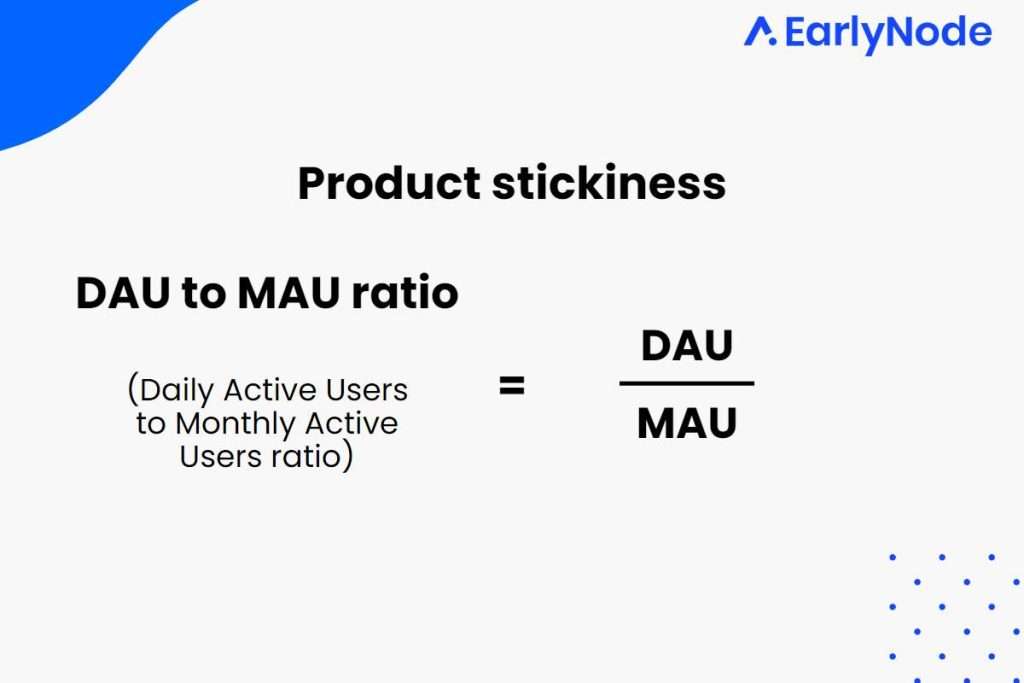
Product stickiness
Product stickiness is a useful metric that measures how engaged customers are with your product. It gives insight into whether they’re using it for the intended function and if they’re doing so as regularly as you expect. Stickiness gives you confidence that they’ll renew their subscription.
To calculate this figure, compare the product’s average monthly users (MAU) against its daily users (DAU). Ideally, you want to have a higher DAU/MAU ratio. If more active users are using your app daily, it means they find it engaging and that’s why they’ll keep coming back.
For deeper insight, calculate this among different customer segments to identify which cohorts have successful usage patterns. You can use that information to run targeted marketing campaigns or improve onboarding experiences for similar users.
Once you understand your users' activation cycles, it’s a good idea to track this on different predefined periods. For example, let’s assume it takes 2-3 days for users to reach a certain activity milestone. If they haven't triggered it by day 3, that’s a bad result. So it’s better to track this metric at 3-day active users instead of daily.
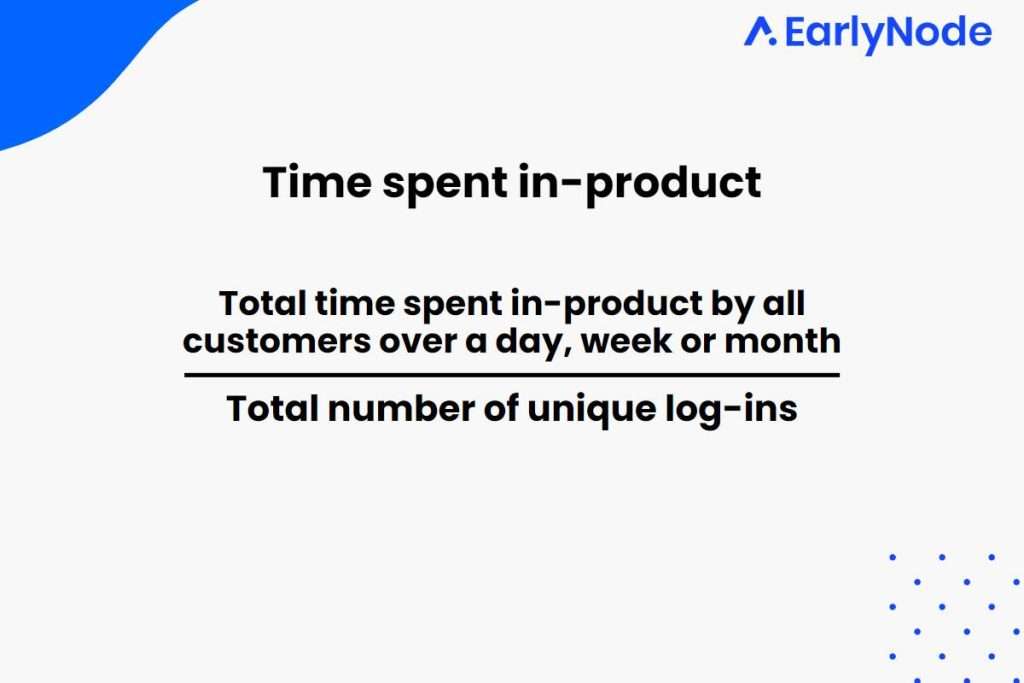
Time spent in-product / Session duration
This metric is different from usage frequency; it monitors how long a user uses your product after logging in. The ideal time spent depends on your product, though for most products, the longer, the better.
For example, some products are designed to engage users for a long time, meaning that a long average time spent in-product is a good sign. But if your product is typically supposed to help users get stuff done quickly, like automation software, then a high frequency of short time spent might be ideal.
You can use this formula to measure your average time spent in-product:
💡 Pro tip: Length of duration alone isn’t a strong data point because it doesn’t tell you whether a user is actually doing something meaningful in that session. To glean quality insights, exclude anything that might screw up this data e.g., users who are in your app for less than 15 seconds. Another way of doing this is to look at the median figure instead of the average.
How can you use product usage data to increase retention and loyalty?
#1 Re-engage inactive customers
Usage analytics can help you identify inactive users so you can take steps to re-engage them before they churn. First, segment your inactive customers, then study them to determine why they’re inactive. Maybe they’re not seeing how your product helps their jobs-to-be-done.
You can send personalized emails highlighting your product’s value, provide additional self-help resources, or point them to customer success. Maybe that’ll encourage them to come back.
#2 Study your power users (and replicate their path to success)
Your power users are like your biggest fans and your best source of quality feedback. They’ve been adopters for a long time and know your product’s strengths and flaws. Study their usage behavior to understand what made them loyal.
Could it be that your onboarding activated them quickly and effectively? Or did your product’s easy-to-use features help them solve their jobs-to-be-done? Their usage data can help you develop strategies for users with similar characteristics and needs.
💡 Pro tip: Loyal users are a precious asset so you need to understand and protect them. When you make changes to add value for other users, make sure they don’t negatively affect your power users.
#3 Remove friction from the user experience
Your product usage data can help you understand where and why users bounce off. Remove any unnecessary tension that prevents users from experiencing value or getting the job done.
There are a few ways to do this:
- Reduce the number of steps required to complete a task
- Make in-app navigation clear and obvious.
- Use UI patterns and elements that are familiar to users e.g., magnifying glass for search.
- Break up complex tasks into smaller sub-tasks.
#4 Collect targeted feedback
Product usage data can tell you which users you should contact for extensive feedback. You can use that feedback to tweak your product to improve stickiness or ease of use.
#5 Drive conversions with in-app prompts
You can use usage data to employ tailored in-app strategies to increase conversion rates. For instance, if a paid user explores a plan upgrade but doesn't complete the purchase, you can prompt them with an alert offering a discount. This could persuade them to take advantage of the deal.
How to collect product usage data in SaaS
There are a few ways to collect usage data without resorting to guesswork. Let’s take a look at 3 common ones:
🎯 Set and track in-app milestones throughout the user journey
Usage milestones help you understand what users try to accomplish when they log in. You can set up milestones that you expect your user to reach as they journey through your product.
You’ll know they’re using your product correctly if they successfully reach those milestones. If not, you’ll need to investigate why they’re not meeting those objectives and how you can help them get there.
A milestone could be:
- Completing a tutorial
- Landing on a key feature
- Completing a meaningful action in a feature
- Successfully sharing their referral code
📲 Use session recordings to track in-app behavior
Session recordings can capture practically every kind of in-app activity: clicks, taps, mouse movements, scrolls, window size adjustments, and more. They’ll help you get a real-time understanding of how your users interact with your features. For instance, you can track if a user takes too long to complete an action or bounces off after landing on a key feature.
💻 Use heatmaps to pinpoint areas of high and low engagement
You can use heatmaps to monitor areas that get lots of engagement (usually called “hotspots”), such as a popular feature, and compare it with other parts that users interact with least.
For example, if a user seems to spend a lot of time on areas without taking any significant action, they’re probably distracted because your site is too busy. Or if they’re clicking on elements that aren’t clickable, it indicates that your design may be confusing.
Other things you can spot with a heatmap include:
- Scrolls that don’t reach the bottom of a page
- Mouse cursor movements
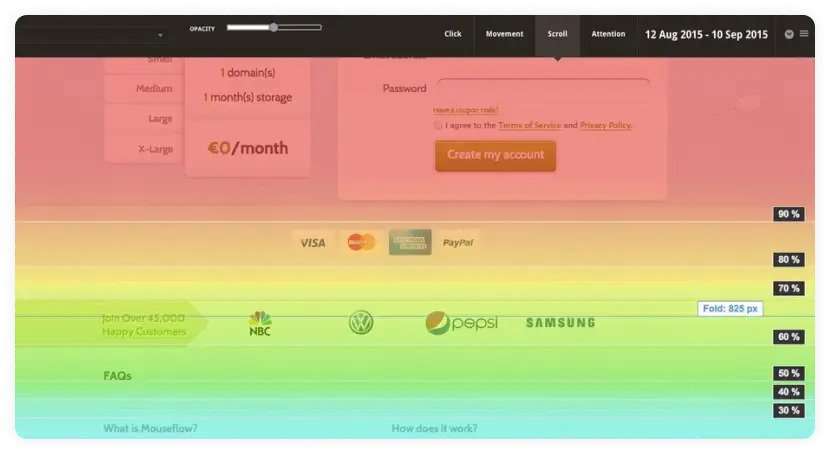
Image source: Mouseflow
Heatmaps also help you optimize your product for better engagement. For example, you could reposition a key section closer to the “hotter” points to make it easier for users to find.
What are the best tools for tracking product usage data?
Before choosing a tool, define the objective and scope of the tracking. In other words, what you want to know about user behavior and how detailed the data should be. Then use that information to guide your choice.
Userpilot
Userpilot is a product analytics tool that tracks user behavior holistically and creates different customer segments for product usage.
With Userpilot, you can:
- set up and monitor in-app goals
- create user segments based on product usage or in-app behavior
- track features usage
Mixpanel
Mixpanel is also a tool you can use to monitor user interactions. Mixpanel allows you to:
- track where users drop off on the website
- monitor user activity in real-time
- identify and group different user segments
ReleaseLog is a changelog tool that can help keep users engaged and boost product usage. It’s ideal for busy founders and PMs who want to send beautiful release notes and product updates to their users in minutes.